
Indices
Eurekahedge Asset Weighted Index Analysis Report (November 2011)
EQUAL WEIGHTED HEDGE FUND INDICES
ASSET WEIGHTED HEDGE FUND INDICES
SPECIALIST ALTERNATIVE FUND INDICES
INVESTIBLE BENCHMARK INDICES
METHODOLOGIES
INDEX PRESS RELEASES
- Index Flash Update (June 2022)
- Index Flash Update (May 2022)
- Index Flash Update (April 2022)
- Eurekahedge launches new benchmark Eurekahedge Multi-Factor Risk Premia Index
- Eurekahedge launch four benchmark indices tracking volatility-based investment strategies
- Eurekahedge and MPI announce new benchmark index tracking the top 50 hedge funds
- Eurekahedge and ILS Advisers launch new USD hedge index
- Eurekahedge launches new insurance linked securities index
- Eurekahedge Asset Weighted Index goes live
- Eurekahedge Asset Weighted Index press release
- EU Benchmark Regulation
| Introduction |
|---|
|
Eurekahedge recently launched a suite of new indices, under the name Eurekahedge Asset Weighted Index*, which are asset weighted and follow a new and unique methodology. In this report we highlight the key features of this set of indices, analyse the risk-return profile and show how the different statistical properties and analysis can be of use to hedge fund investors. * The Eurekahedge Asset Weighted Index was previously launched as the Mizuho-Eurekahedge Index and has since been renamed as of May 2020. Key attributes of the methodology
|
| Performance Summary | ||||||||||||||||||
|---|---|---|---|---|---|---|---|---|---|---|---|---|---|---|---|---|---|---|
|
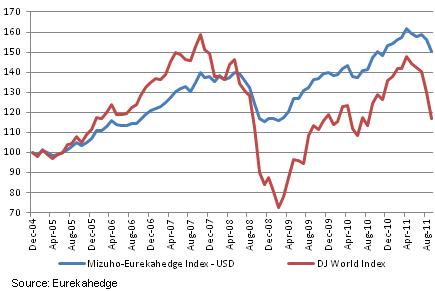
Figure 1 displays the Eurekahedge Asset Weighted Index and the Dow Jones World Index and Table 1 shows the corresponding risk return metrics. Figure 1: Eurekahedge Asset Weighted Index vs DJ World Index
When compared to the underlying equity markets the1 the Eurekahedge Asset Weighted Index has witnessed better performance over the last six and a half years, with less than half the volatility and a low beta (correlation to the markets). Total return for the index stands at 50.27% as opposed to a 17.12% gain in the DJ World Index since December 2004. Funds within the Eurekahedge Asset Weighted Index have also provided significant downturn protection – in 2011 the index is down only 2.03% (September YTD) compared to an average 13.74% decline in global markets. Since December 2004, the maximum drawdown of the Eurekahedge Asset Weighted Index is 17.38%, while that of the DJ World Index stands at 54.38%. Table 1: Risk-return statistics of Eurekahedge Asset Weighted Index and DJ World Index
Source: Eurekahedge |
| Funds | % of EAWI | Assets (US$ billion) | % of EAWI | Annualised Return | Difference from EAWI index (ret) | 2008 Return | Annualised Volatility | Difference from EAWI (vol) | |
|---|---|---|---|---|---|---|---|---|---|
| EAWI | 1441 | 100.0% | 480 | 100.0% | 6.2% | NA | -15.1% | 7.2% | NA |
EAWI (USD Hedge) |
1441 |
100.0% |
480 |
100.0% |
5.6% |
-0.6% |
-14.1% |
5.7% |
-1.5% |
EAWI (EUR Hedge) |
1441 |
100.0% |
480 |
100.0% |
5.4% |
-0.9% |
-12.8% |
5.6% |
-1.6% |
EAWI (JPY Hedge) |
1441 |
100.0% |
480 |
100.0% |
3.3% |
-3.0% |
-16.0% |
5.7% |
-1.5% |
EAWI Emerging Markets |
154 |
10.7% |
34 |
7.1% |
10.6% |
4.4% |
-25.7% |
12.2% |
5.0% |
EAWI Asia Pacific |
212 |
14.7% |
42 |
8.7% |
5.6% |
-0.6% |
-21.2% |
9.4% |
2.2% |
EAWI Asia Pacific ex-Japan |
105 |
7.3% |
22 |
4.6% |
8.6% |
2.4% |
-34.7% |
14.3% |
7.1% |
EAWI L/S Equity |
620 |
43.0% |
156 |
32.5% |
4.9% |
-1.4% |
-22.5% |
10.1% |
2.9% |
EAWI Multi-Strategy |
203 |
14.1% |
95 |
19.7% |
8.2% |
2.0% |
-17.5% |
7.2% |
-0.1% |
EAWI Arbitrage |
232 |
16.1% |
94 |
19.6% |
6.6% |
0.4% |
-13.5% |
5.7% |
-1.6% |
EAWI CTA/ Managed Futures |
176 |
12.2% |
65 |
13.5% |
6.5% |
0.3% |
19.2% |
9.9% |
2.6% |
EAWI Event Driven |
110 |
7.6% |
40 |
8.2% |
6.9% |
0.7% |
-17.5% |
7.2% |
-0.1% |
EAWI Macro |
100 |
6.9% |
31 |
6.5% |
5.2% |
-1.1% |
-6.0% |
7.4% |
0.2% |
EAWI Asia Pacific L/S Equity |
150 |
10.4% |
28 |
5.8% |
6.0% |
-0.2% |
-25.9% |
11.3% |
4.1% |
EAWI Asia Pacific Multi-Strategy |
26 |
1.8% |
7 |
1.4% |
5.3% |
-0.9% |
-17.2% |
8.3% |
1.1% |
EAWI Asia Pacific Arbitrage |
18 |
1.3% |
3 |
0.7% |
5.6% |
-0.7% |
-0.7% |
4.3% |
-2.9% |
EAWI Asia Pacific ex-Japan L/S Equity |
81 |
5.6% |
17 |
3.5% |
8.9% |
2.7% |
-36.7% |
15.4% |
8.2% |
EAWI Asia Pacific ex-Japan Multi-Strategy |
26 |
1.8% |
7 |
1.4% |
12.9% |
6.6% |
-41.5% |
18.5% |
11.3% |
EAWI Emerging Markets L/S Equity |
46 |
3.2% |
11 |
2.2% |
10.7% |
4.5% |
-27.1% |
13.7% |
6.5% |
EAWI Emerging Markets Multi-Strategy |
54 |
3.8% |
10 |
2.2% |
14.7% |
8.4% |
-20.0% |
13.6% |
6.4% |
EAWI Emerging Markets Arbitrage |
22 |
1.5% |
5 |
1.0% |
5.1% |
-1.1% |
-27.6% |
10.4% |
3.2% |
| EAWI 300 | 300 |
20.8% |
353 |
42.1% |
6.3% |
0.1% |
-14.1% |
6.8% |
-0.4% |
| EAWI 100 | 100 |
6.9% |
244 |
50.7% |
7.1% |
0.9% |
-11.6% |
6.3% |
-0.9% |
Source: Eurekahedge
| Turnover rates | ||||||||||||||||||||||||||||
|---|---|---|---|---|---|---|---|---|---|---|---|---|---|---|---|---|---|---|---|---|---|---|---|---|---|---|---|---|
|
Turnover rate implies the number of funds that are replaced in the index or a portfolio over the course of time. For this discussion we consider the Eurekahedge Top100 Asset Weighted Index, which displays an average annually turnover rate 32%. This is calculated by taking the difference between the index constituents at the start of a year and the index constituents at the start of the following year. For example in any given year if you invest in 100 funds on December 31 you could expect to maintain holdings in 68 of those funds at the end of the year with 32 new funds in your portfolio. Since the index comprises of only the largest 100 funds that report to the Eurekahedge databases, the primary reasons for fund turnover is:
This suggests that the Top 100 Index broadly follows a momentum (or populist) strategy, where the larger and more successful hedge funds would be added to the index while the funds which lose capital (either through performance or asset flows) would be taken out of the index. Table 3: Turnover rate of index constituents of the Eurekahedge Asset Weighted Top 100 Index
Source: Eurekahedge
1
Represented here by the Dow Jones World Index |
