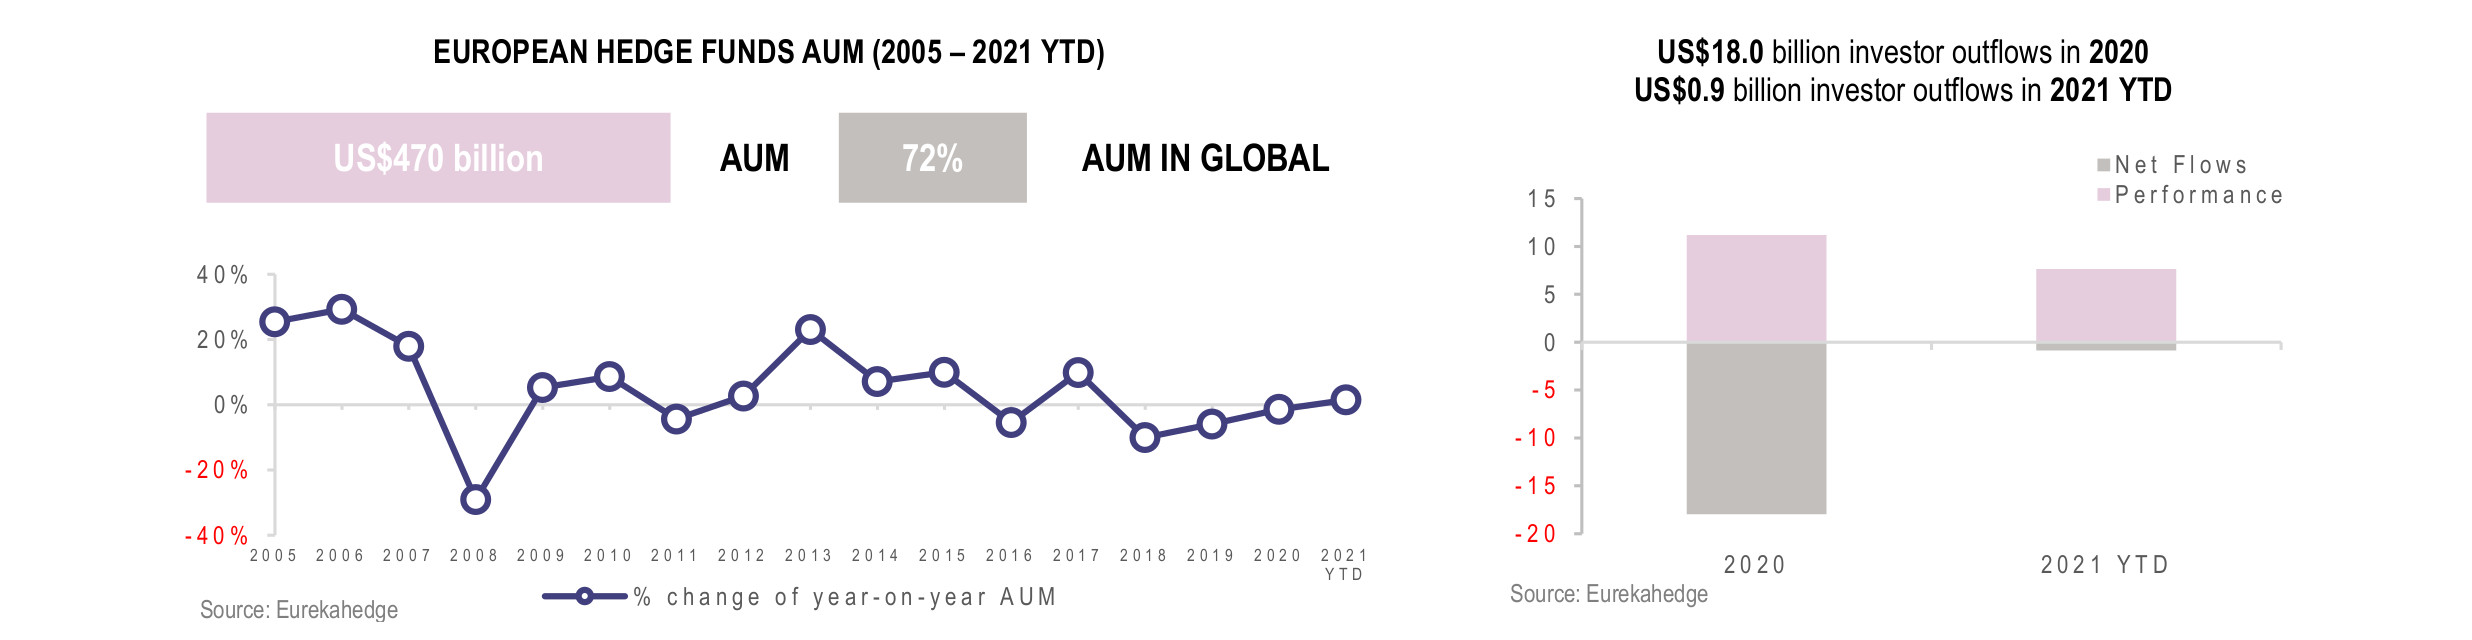
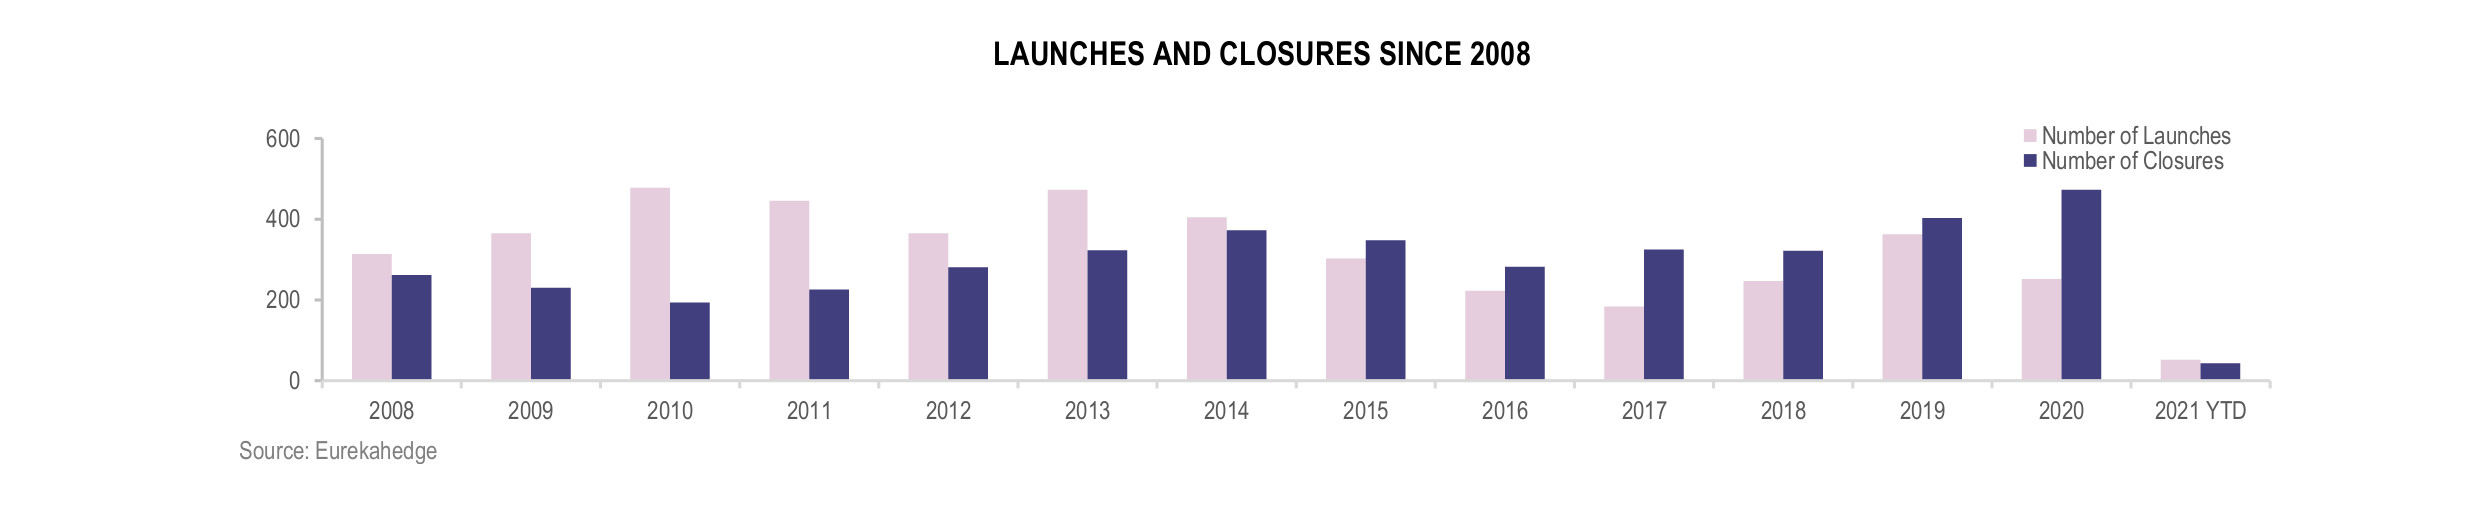
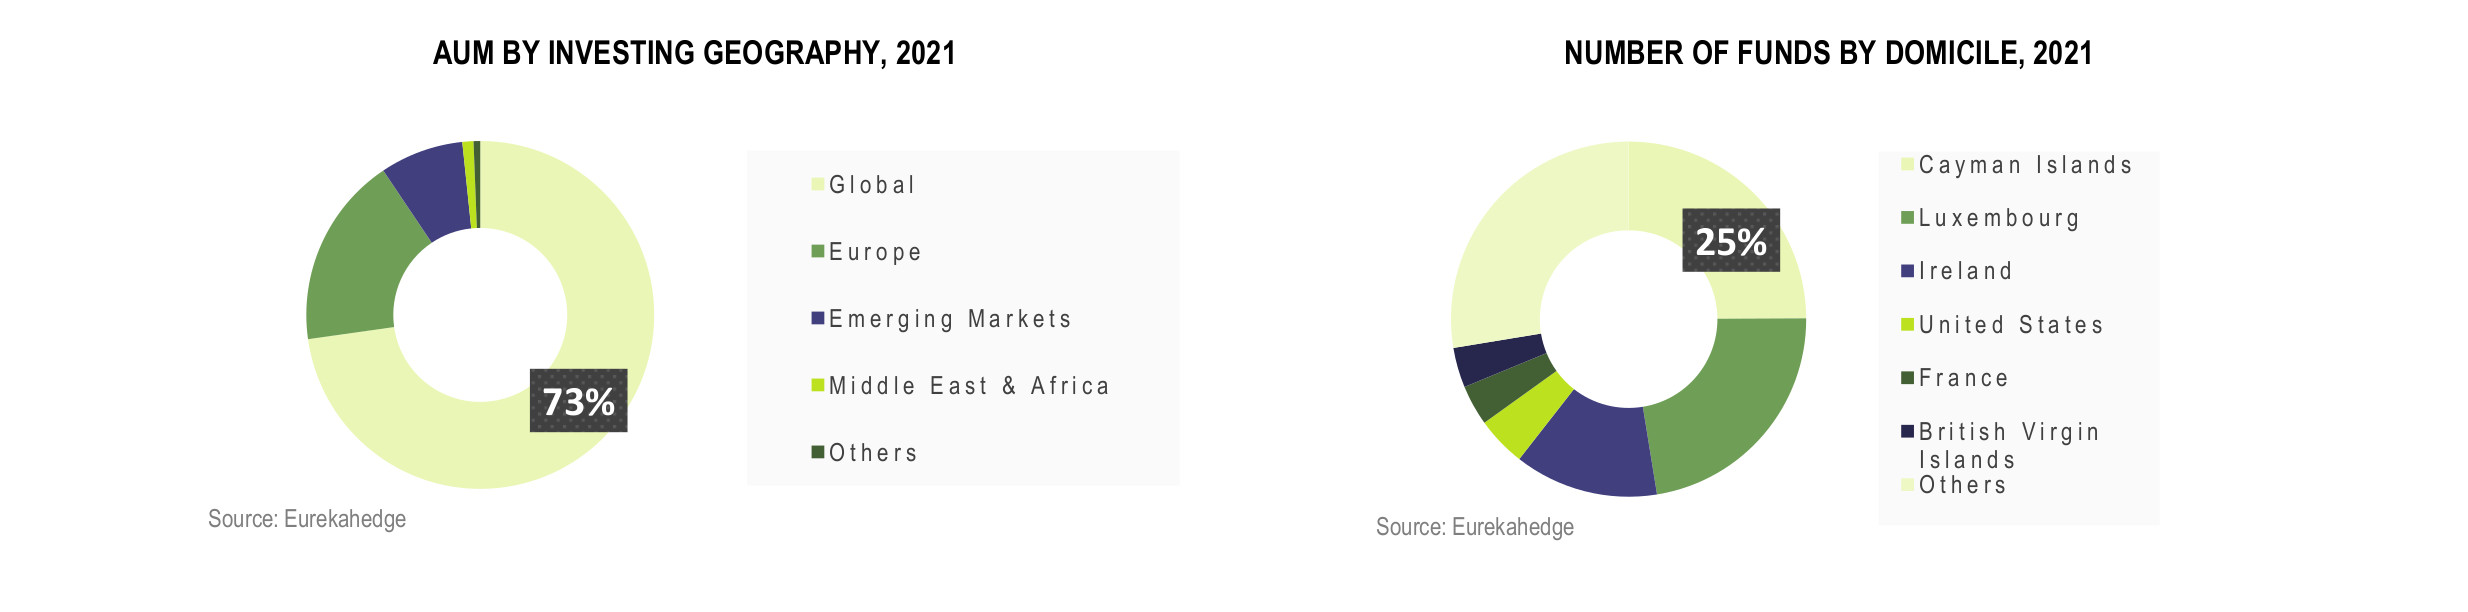
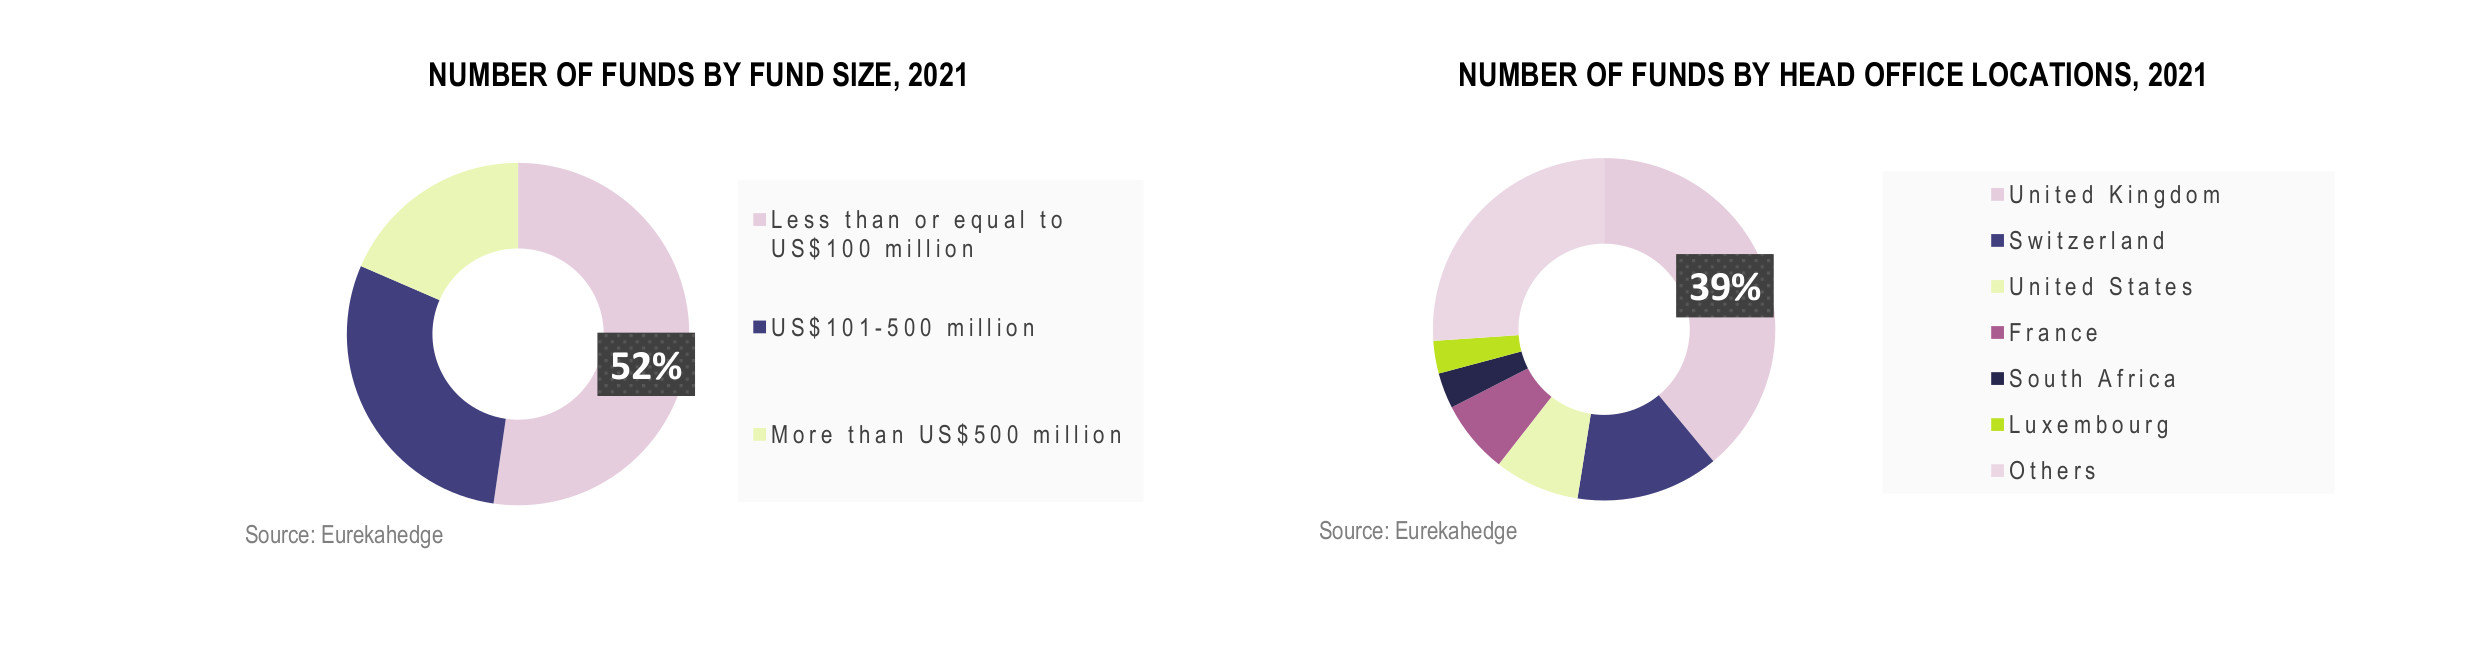
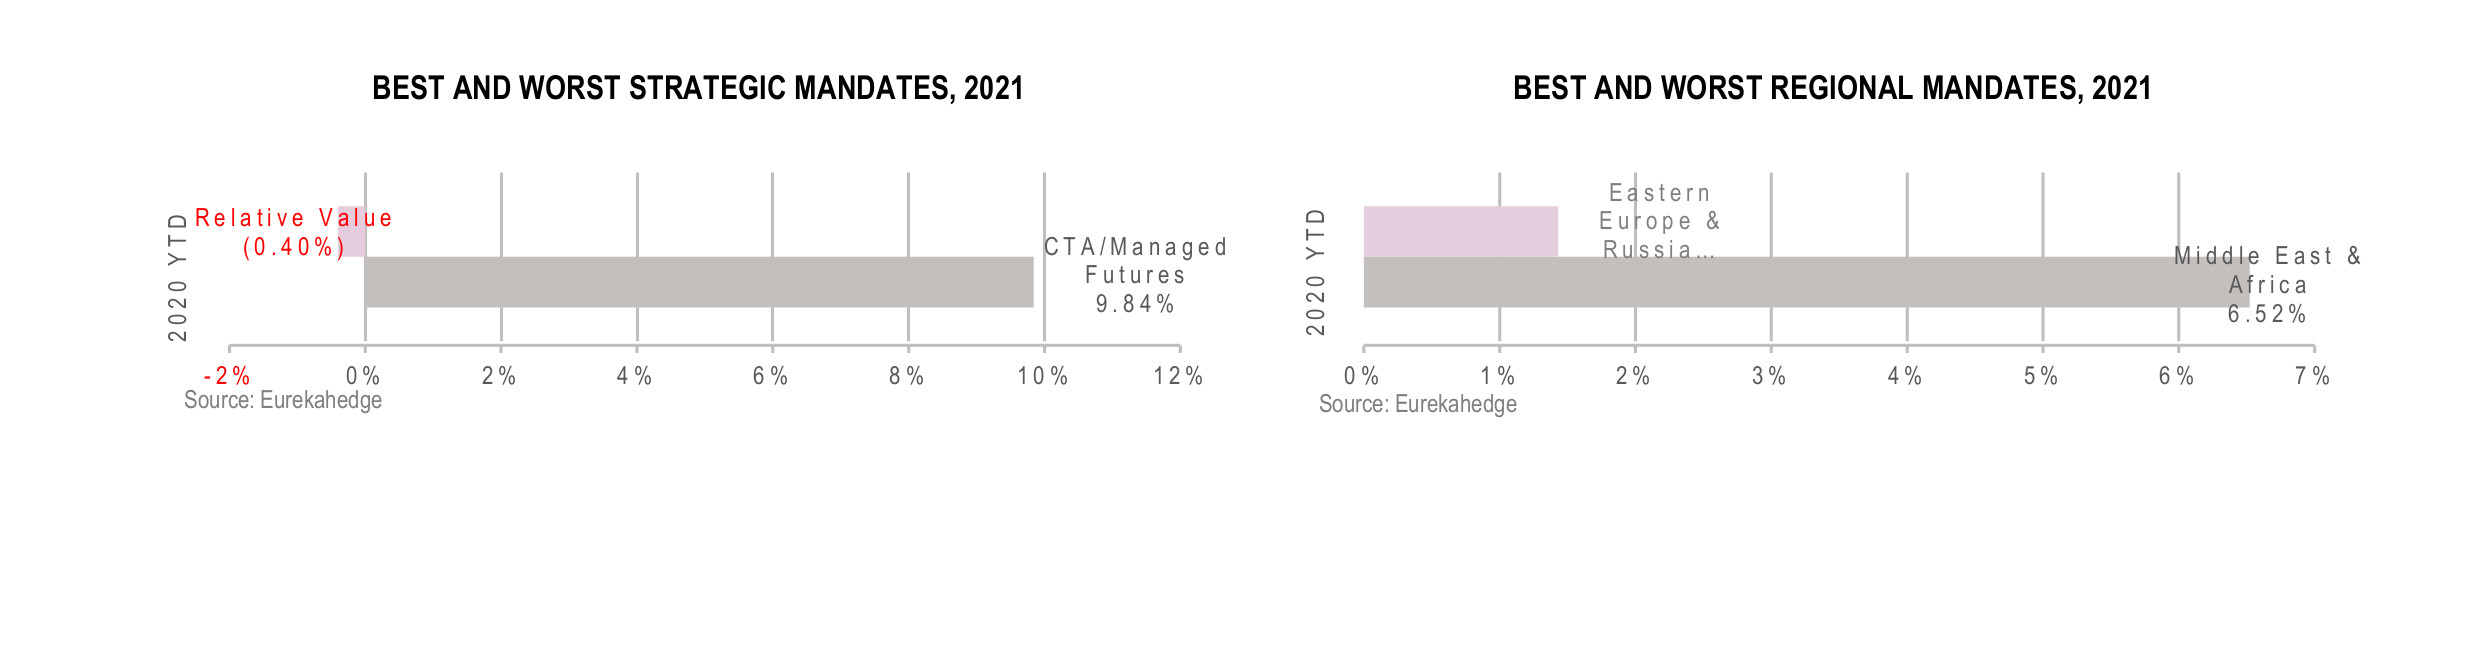
Eurekahedge’s European hedge funds infographic sums up the industry as at May 2021. Find out more about European funds assets under management (AUM), asset flows into strategic and regional mandates, strategy returns, fund size and geographic AUM, head office locations and the best and worst performances of the year.
![European Hedge Funds Infographic May 2021 - AUM](http://www.eurekahedge.com/content/images/news/infographics/Eurekahedge-Hedge-Funds-Infographic-May-2021-European-Hedge-Funds-AUM.jpg)
![European Hedge Funds Infographic May 2021 - Launches and Closures](http://www.eurekahedge.com/content/images/news/infographics/Eurekahedge-Hedge-Funds-Infographic-May-2021-European-Hedge-Funds-Launches-Closures.jpg)
![European Hedge Funds Infographic May 2021 - AUM by investing geography and AUM by strategy](http://www.eurekahedge.com/content/images/news/infographics/Eurekahedge-Hedge-Funds-Infographic-May-2021-AUM-by-Investing-Geography-Strategy.jpg)
![European Hedge Funds Infographic May 2021 - Number of funds by fund size and head office locations](http://www.eurekahedge.com/content/images/news/infographics/Eurekahedge-Hedge-Funds-Infographic-May-2021-Number-of-Funds-by-Fund-Size-Head-Office-Locations.jpg)
![European Hedge Funds Infographic May 2021 - best and worst strategy and regional mandate](http://www.eurekahedge.com/content/images/news/infographics/Eurekahedge-Hedge-Funds-Infographic-May-2021-Best-And-Worst-Strategy-Regional-Mandate.jpg)