


ANDA Cruise, FengHe Asia Fund, Golden Pine Fund, KS Asia Absolute Return Fund, Realm High Income Fund, and Segantii Asia Pacific Equity Multi-Strategy Fund outshine peers in 2018
The Asian hedge fund managers tracked by Eurekahedge ended 2018 down 8.71% on average, recording their worst yearly performance since the 2008 global financial crisis. In spite of a strong start in January, the return of market volatilities in February and the escalation of the trade tension between the United States and China pushed the majority of Asian hedge funds into the red for the year. Compared to their global peers, fund managers focusing on Asia suffered heavier blows from the equity market sell-offs in response to the US Federal Reserve’s aggressive rate hikes throughout the year. Over one-third of the hedge fund managers comprising the Eurekahedge Asian Hedge Fund Index recorded double-digit losses in 2018, as they struggled to navigate through the chaotic markets during the year. Nevertheless, a select few of the Asian hedge fund managers in the Eurekahedge database successfully traded their way through the year and generated double-digit outperformance against the region’s underlying equity markets, signifying the chasm between these noteworthy fund managers and the rest of the industry.
At the most fundamental level, hedge fund investing has always been, and probably will always be a matter of identifying the best performing fund managers capable of consistently outperforming the majority of their peers, as well as the traditional assets. This piece will focus on the best performing Asian hedge funds tracked by Eurekahedge which managed to generate positive returns despite all of the challenges faced by the industry last year. Collectively, these funds manage a total of US$13.0 billion as of February 2019 and have an average lifespan of 6.5 years. To illustrate the performance of these remarkable hedge fund managers, the Eurekahedge Custom Asia Top Gainer Composite, an equal-weighted custom index was constructed based on the performance of these funds. Commentaries from some of these exceptional hedge fund managers are featured in the report to provide insights for the readers into their funds’ successes in 2018, as well as their expectations on the upcoming year.
Figure 1 provides the strategy breakdown of these hedge funds. Long/short equities, multi-strategy and fixed income were the most commonly employed strategic mandates, accounting for 50%, 20% and 15% of these constituent funds respectively.
|
Figure 1: Strategy breakdown of the
|
Segantii Asia-Pacific Equity Multi-Strategy Fund1 The fund outperformed the Eurekahedge Asia inc Japan Hedge Fund Index by 19.88% in 2018 |
|
“Segantii Capital Management Ltd. was established in 2007 and is headquartered in Hong Kong with an office in London. The firm manages US$3.3 billion of investor capital in a single fund – The Segantii Asia-Pacific Equity Multi-Strategy Fund. The fund adopts a multi-strategy team-based approach and runs two principal strategies – Relative Value and Opportunistic Events. Investments are made in a variety of global equity, equity-linked and credit instruments with a bias towards Asia. The portfolio is diverse, actively-traded and maintains a low net market exposure. The fund aims to deliver consistent double-digit net returns throughout the cycle whilst maintaining minimal correlation to equity markets. Since inception, the fund has gained over 390%, returning 15.23% on an annualised basis with a Sharpe ratio of 1.72 and has a proven track record of downside protection. In 2018, the fund generated gains in both Relative Value and Opportunistic Events strategies – including during the fourth quarter's volatile market environment finishing the year +11.36%. The fund was able to take advantage of these conditions by maintaining a tightly hedged, liquid and low beta portfolio which allowed it to remain active and deliver positive returns to our investors in the face of market turbulence.”
Segantii Capital Management Ltd |
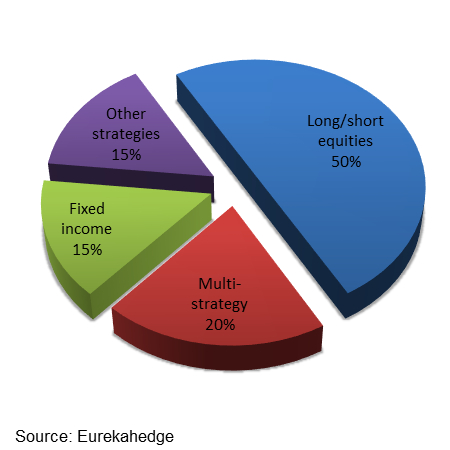
Figure 2 shows the index performance since the end of 2007, which was compared against the underlying Asian equity markets, the average Asian hedge fund industry performance, as well as the Eurekahedge 50 index, which is an annually rebalanced custom index representing 50 large hedge funds expected to deliver superior risk-return profile.
Figure 2: Performance of the Eurekahedge Custom Asia Top Gainer Composite since the end of 2007
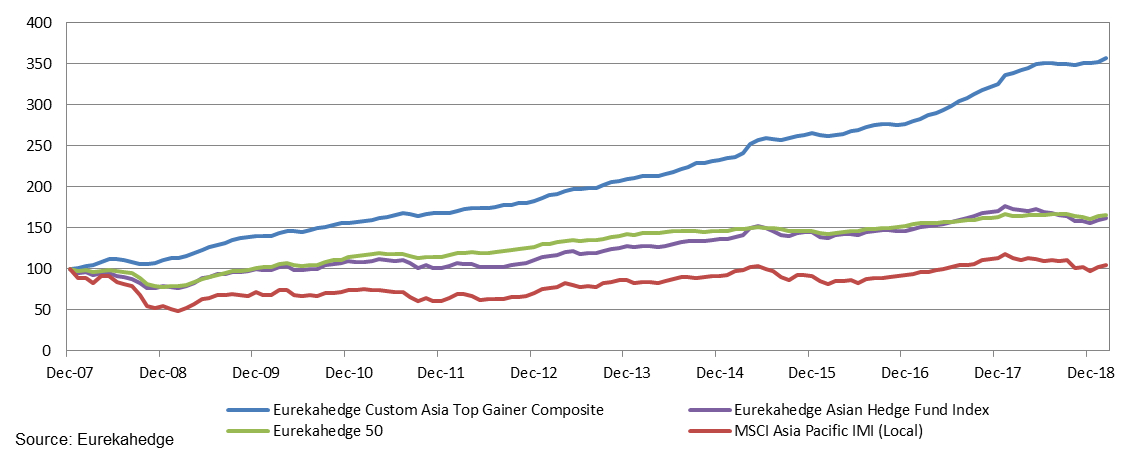
Over the long-term period starting from the end of 2007, the Eurekahedge Custom Asia Top Gainer Composite has returned 12.08% per annum, significantly outperforming the annualised returns posted by the Eurekahedge Asian Hedge Fund Index (4.45%), the Eurekahedge 50 (4.60%), and the MSCI Asia Pacific IMI in local currencies (0.46%).
Table 1: Performance in numbers - Eurekahedge Custom Asia Top Gainer Composite against comparable benchmarks
|
Eurekahedge Custom Asia Top Gainer Composite
|
Eurekahedge Asian Hedge Fund Index
|
Eurekahedge 50
|
MSCI Asia Pacific
IMI (Local)
|
|
|---|---|---|---|---|
|
2008
|
11.24%
|
(21.06%)
|
(21.58%)
|
(45.50%)
|
|
2009
|
25.79%
|
26.81%
|
29.35%
|
31.19%
|
|
2010
|
11.73%
|
9.15%
|
13.12%
|
4.67%
|
|
2011
|
7.56%
|
(7.50%)
|
(0.17%)
|
(18.20%)
|
|
2012
|
8.64%
|
9.66%
|
11.10%
|
16.42%
|
|
2013
|
14.46%
|
15.21%
|
11.69%
|
22.08%
|
|
2014
|
11.47%
|
6.95%
|
3.04%
|
5.17%
|
|
2015
|
14.14%
|
6.46%
|
(0.01%)
|
(0.09%)
|
|
2016
|
4.19%
|
0.55%
|
4.27%
|
1.24%
|
|
2017
|
17.57%
|
17.10%
|
6.96%
|
23.12%
|
|
2018
|
7.77%
|
(8.71%)
|
(1.50%)
|
(14.94%)
|
|
2019 year-to-date
|
1.70%
|
4.07%
|
2.71%
|
8.56%
|
|
3 year annualised returns
|
10.91%
|
5.78%
|
4.92%
|
9.03%
|
|
3 year annualised volatility
|
2.55%
|
5.14%
|
2.77%
|
10.43%
|
|
3 year Sharpe Ratio (RFR = 2%)
|
3.50
|
0.74
|
1.06
|
0.67
|
|
5 year annualised returns
|
10.91%
|
4.85%
|
2.76%
|
4.56%
|
|
5 year annualised volatility
|
3.18%
|
5.93%
|
2.85%
|
11.36%
|
|
5 year Sharpe Ratio (RFR = 2%)
|
2.80
|
0.48
|
0.27
|
0.23
|
|
10 year annualised returns
|
12.13%
|
7.73%
|
7.60%
|
7.89%
|
|
10 year annualised volatility
|
3.19%
|
6.93%
|
4.24%
|
12.94%
|
|
10 year Sharpe Ratio (RFR = 2%)
|
3.17
|
0.83
|
1.32
|
0.46
|
|
10 year maximum drawdown
|
(1.99%)
|
(11.32%)
|
(5.45%)
|
(21.48%)
|
Source: Eurekahedge
Table 1 provides the detailed risk return statistics of the Eurekahedge Custom Asia Top Gainer Composite and comparable investment vehicles represented by the Eurekahedge Asian Hedge Fund Index, the Eurekahedge 50, and the MSCI Asia Pacific IMI (Local). Key takeaways include:
- The Eurekahedge Custom Asia Top Gainer Composite returned 7.77% in 2018, vastly outperforming the broader Asian hedge fund industry which ended the year down 8.71%. Going into 2019, the Eurekahedge Custom Asia Top Gainer Composite was up 1.70% over the first two months of the year, trailing behind the region’s equity markets which gained 8.56% driven by optimism over the easing US-China trade friction and dovish stance exhibited by the Fed. However, slowing global economic growth remained as a major concern in 2019, as major central banks cut their growth forecasts for the year.
- The top fund managers tracked by the Eurekahedge Custom Asia Top Gainer Composite have been able to especially distinguish themselves during periods of notable market downturns such as 2008, 2011, and 2018, in which they outperformed the average Asian hedge fund managers by 32.30%, 15.06%, and 16.48% respectively.
- In terms of risk-adjusted performance, the Eurekahedge Custom Asia Top Gainer Composite managed to generate Sharpe ratios of 3.50 over the last three years, and 2.80 over the last five years. These figures are significantly higher than those generated by average Asian hedge fund managers, as represented by the Eurekahedge Asian Hedge Fund Index.
- The downside protection exhibited by these skilled hedge fund managers could also be observed from the -1.99% maximum drawdown posted by the Eurekahedge Custom Asia Top Gainer Composite over the last 10 years, vastly outperforming the Eurekahedge Asian Hedge Fund Index and the underlying equity market which posted maximum drawdowns of -11.32% and -21.48% respectively over the same period.
|
KS Asia Absolute Return Fund 2
The fund outperformed the Eurekahedge Asia inc Japan Hedge Fund Index by 28.69% in 2018 |
FengHe Asia Fund 3 The fund outperformed the Eurekahedge Asia ex Japan Hedge Fund Index by 19.80% in 2018 |
|
“Gen2 Partners is a multi-strategy, multi-disciplinary investment management firm whose assets have grown rapidly in the last 12 months from US$900 million at the beginning of 2018 to approximately US$1.6 billion being managed as of January 2019. The KS Asia Absolute Return Fund is a Pan-Asian multi-strategy fund active across the capital structure of listed Asian corporations. The fund invests in a wide range of asset classes, with particular focus on Asian financials and TMT sectors. For the year ending 2018, performance for KS Asia Absolute Return Fund was up 20.17%. In addition, the fund has produced positive returns each year and is up 292.12% since inception with a Sharpe ratio 2.18. Gen2 Partners remains cautiously optimistic about performance in 2019 whilst carefully monitoring a number of important macro events. Gen2 feels that the possibility of future rate hikes is diminishing as markets approach the late end of the cycle; without any major catalyst at present to go into depression. As a strategy, Gen2 prefers to hold investments of sound credit quality which also provide positive carry for the Fund. Gen2 continues to trade opportunistically in the market, leaving cash to deploy in the event of any future reoccurrence of volatility as witnessed last year. During the course of this year, Gen2 will seek to expand their team to capture new opportunities and to position for the next stage of development.” Gen2 Partners Ltd |
“FengHe Asia’s net return of +10.38% for 2018 compared well to the performance of Asian markets and most Asian investment managers. 2018 was very difficult, similar to 2015 when Asian markets crashed. Yet, FengHe Asia did well in both years and has clearly shown its consistent ability to outperform during adverse market conditions as evidenced by the Fund’s net returns of +10.38% for 2018 and +23.88% for 2015. Our ability to outperform is driven, and made sustainable by our disciplined and systematic approach to investment and risk management. After a turbulent and fearful 2018, we see two potential types of circumstances in 2019 across the companies we cover. The first will form our pipeline of shorts. For this group, fear has become reality and profits will deteriorate, with stock prices continuing the slide after the initial valuation corrections in 2018 from the highs of 2017. The second will form our pipeline of long ideas. For this group, fear is just fear and we believe that profits will grow more than expected with stock prices being driven by both valuation recovery and profit growth. Going forward, we are very optimistic of the long-short opportunities across our coverage stocks and we strongly believe that 2019 can be exceptional for FengHe Asia.”
FengHe Fund Management Pte Ltd |
Table 2: Correlation matrix
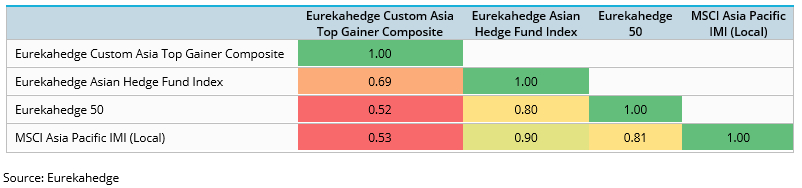
Table 2 below provides the correlation values between the performances of the four indices shown in the previous table. The Eurekahedge Custom Asia Top Gainer Composite posted a correlation coefficient of 0.53 against the MSCI Asia Pacific IMI (Local), indicating that these funds are significantly less correlated to the region’s equity markets compared to average Asian hedge funds, which posted a correlation coefficient of 0.90 against the equity markets.
|
Golden Pine Fund - Class P4
The fund outperformed the Eurekahedge Greater China Hedge Fund Index by 23.07% in 2018 |
Realm High Income Fund5 The fund outperformed the Eurekahedge Australia/New Zealand Hedge Fund Index by 7.30% in 2018 |
|---|---|
|
“The remarkable fund performance is attributed to the fund manager’s unique perspectives of (1) in-depth research, (2) sector selection and (3) portfolio management. Thirdly, the fund is able to find both long and short opportunities by our outstanding top-down approach, industry research and firm analysis. As a result, the fund holds around 120% to 175% of gross exposure and 40% to 80% of net exposure, which allows flexibility to face dramatic market changes. Furthermore, 80% of the investments are diversified among large and mid-caps in multiple sectors. As a result, in times of market correction and panic in 2018, 2/3 of the gross return was contributed by the short positions and 1/3 by long positions. The portfolio generated considerable alpha against benchmark.”
Golden Pine Asset Management Ltd |
“The Realm High Income Fund is a long-only strategy, as such the portfolio will always exhibit beta to investment-grade credit markets. However, the flexibility of the manager’s mandate and the contrarian approach taken in execution sees the manager maximise upside capture while minimising drawdowns. Realm’s first approach allows them to proactively budget for a level of tracking error which is consistent with their view around value and market outlook. This generally sees the portfolio increase total tracking error when risk is well-compensated and reduce it where market complacency is high. The risk first approach sees portfolio settings considered with a focus on capital preservation. The key objective is building a portfolio which will maximise the pay-out for risk (focus on the information ratio of positions and the portfolio as a whole). The manager focuses on facilitating their strategy to independent financial advisers, private banks and high-net-worth individuals. The manager’s steady increase in funds under management (FUM) since inception speaks of high retention and solid growth in FUM and adviser adherents. The manager targets a return of 3X tracking error over the Australian cash rate as an internal target. Over time the strategy targets a return of 3% over cash. Importantly the manager does not yield target, but rather seeks to vary budgeted risk to maximise returns in good years and minimise drawdowns in bad years. The strategy has delivered a return which ranks them highly versus peers in the Australian alternative credit sector over 5 years and we believe it will continue to deliver a strong risk-adjusted return versus peers.”
Realm Investment House |
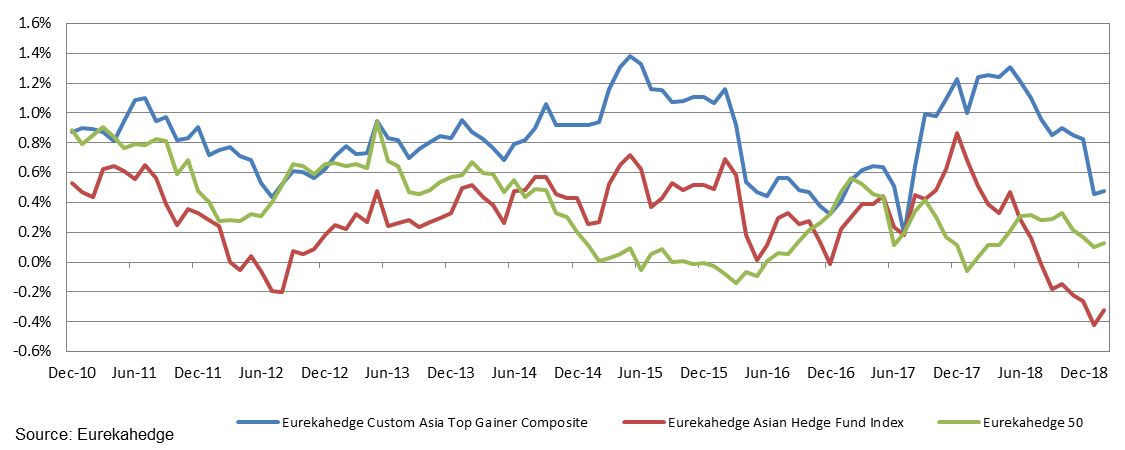
In Figure 3, the 12-months rolling alpha of the three alternative investment vehicles against the underlying Asian equity markets is displayed. Since the end of 2010, the Eurekahedge Custom Asia Top Gainer Composite has almost consistently maintained an alpha of at least 0.40% over the MSCI Asia Pacific IMI (Local). It is worth noting that these fund managers exhibit lower alpha during periods of strong bull market such as 2017 and early 2019.
Figure 3: 12-months rolling alpha against the MSCI Asia Pacific IMI (Local) (RFR = 0%)
|
ANDA Cruise6
The fund outperformed the Eurekahedge Asia ex Japan Hedge Fund Index by 13.60% in 2018 |
|---|
|
“ANDA Cruise employs a wide range of strategies (equity, convertibles, event-driven, etc.) to exploit market inefficiencies across multiple asset classes in order to produce more stable compounded returns with less directional exposure to equity markets within Korea. From its inception, the fund has been positive each year and delivered a 9.04% annualised return with a 5.17% annualised standard deviation. As the fund approaches its five-year anniversary, the positive performance since inception has led to a successful asset raise with fund AUM at US$201 million. Following strong performance in 2017, Korean equities faced a myriad of internal and external challenges in 2018 which led to a meaningful correction in the equity market. We believe the fund’s performance against benchmarks and peers during the challenging conditions of 2018 demonstrates the advantages of the strategy and its adaptability to rapidly changing market conditions. In 2018 we looked to take advantage of the heighted volatility to capture relative value performance within equities, while our exposure in convertibles helped smooth out the fund’s overall volatility. With the Korean economy slowing down, government bond yields continue to decline and for the first time in history the KOSPI yield is substantially higher than the 10-year government bond. After the introduction of the Stewardship Code in 2016, Korean institutional investors have become increasingly vocal, demanding better capital efficiency from investee companies. We believe spreads will continue to narrow between high-yield preferred and common shares. The economic slowdown, ongoing restructuring of Korean chaebols and increasing shareholder engagement by local investors should create heightened volatility and ample opportunities for the fund in 2019.”
ANDA Asset Management Co Ltd |
Source: Eurekahedge
The full article inclusive of all charts and tables is available in The Eurekahedge Report accessible to paying subscribers only.
Subscribers may continue to login as usual to download the full report and non-subscribers may email database@eurekahedge.com to enquire on how to obtain the full research report
1 Source: Segantii Capital Management Ltd.
Past performance is not indicative of future results.
2 Source: Gen2 Partners Ltd. Past performance is not indicative of future results
3 Source: FengHe Fund Management Pte Ltd.
Past performance is not indicative of future results.
4 Source: Golden Pine Asset Management Ltd. Past performance is not indicative of future results
5 Source: Realm Investment House. Past performance is not indicative of future results
6 Source: ANDA Asset Management Co Ltd. Past performance is not indicative of future results
This material does not constitute investment advice or counsel or solicitation for investment in any fund or product mentioned.
