


The year 2018 might not have been the best year for the hedge fund industry, with the return of market volatilities in the first quarter and the immediately following global trade friction between the world’s two strongest economies. The equal-weighted Eurekahedge Hedge Fund Index was up 0.12% as of September 2018 year-to-date, as fund managers struggled to generate profits amidst the volatile market and difficult trading situation throughout the year. The industry has also seen multiple liquidations of high-profile hedge funds overseeing billions of dollars of assets, as they were incapable of generating returns beyond what the fund managers and investors deem acceptable.
However, at the most fundamental level, hedge fund investing has always been, and probably will always be a matter of identifying the best performing fund managers capable of consistently outperforming the majority of their peers, as well as the underlying equity markets. This piece will focus on the hedge funds tracked by Eurekahedge which managed to attract substantial amount of investor inflows despite all the challenges faced by the hedge fund industry and grew their assets throughout the first three quarters of 2018. Collectively, these funds manage a total of US$182.4 billion as of September 2018 and have an average lifespan of eight years. Short commentaries from some of these exceptional hedge fund managers would be included in the report to provide insights for the readers into their successes.
To illustrate the performance of these remarkable hedge fund managers, the Eurekahedge Top Gainers Index, an equal-weighted custom index was constructed based on the returns of these funds. Figure 1 provides the strategy breakdown of these hedge funds. Long/short equities and fixed income were the two most common strategic mandates utilised by the Eurekahedge Top Gainers Index constituents, accounting for 24% and 22% of the constituent funds respectively. Macro, multi-strategy and CTA/managed futures follow behind with population shares of 16%, 14%, and 10%.
|
Figure 1: Strategy breakdown of the
|
ADG Systematic Macro Fund Ltd1
|
|
“ADG Capital Management LLP runs the ADG Systematic Macro Strategy which has grown from US$15 million at launch in May 2013 to more than US$2.5 billion as of October 2018. The Strategy uses fundamentally-driven multi-factor models to take directional and relative value positions across developed market equity indices, bonds, volatility and FX with risk management an integral part of the investment process. Since inception, the Strategy has been positive each year and delivered annualised returns of 8.8% with a Sharpe Ratio greater than 1. The last two years can be broadly characterised as a risk-on environment with two interruptions in February and October this year. The Strategy has a long-term approach with positions changing gradually over time and for the majority of this period it has maintained an implicit negative beta exposure to equities. This emanates from the long positions in bonds (particularly Bunds), Japanese yen and US dollar and short positions in Swedish krona and Canadian dollar. Combined with other exposures, this proved advantageous during the risk-off months and the Strategy was positive in February, March and October.” ADG Capital Management LLP |
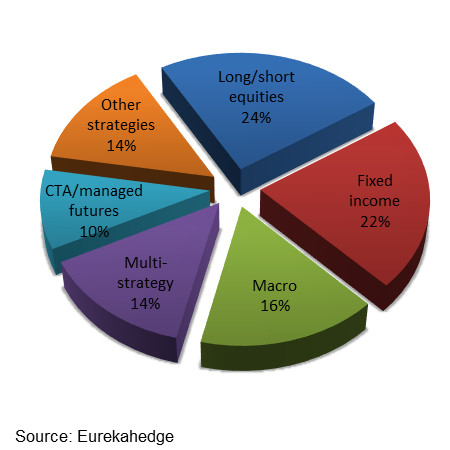
Figure 2 shows the index performance since the end of 2007, which was compared against the underlying global equity market, the average global hedge fund industry performance, as well as the Eurekahedge 50 index, which is an annually rebalanced custom index representing 50 large hedge funds expected to deliver superior risk-return profile.
Figure 2: Performance of the Eurekahedge Top Gainers Index since the end of 2007
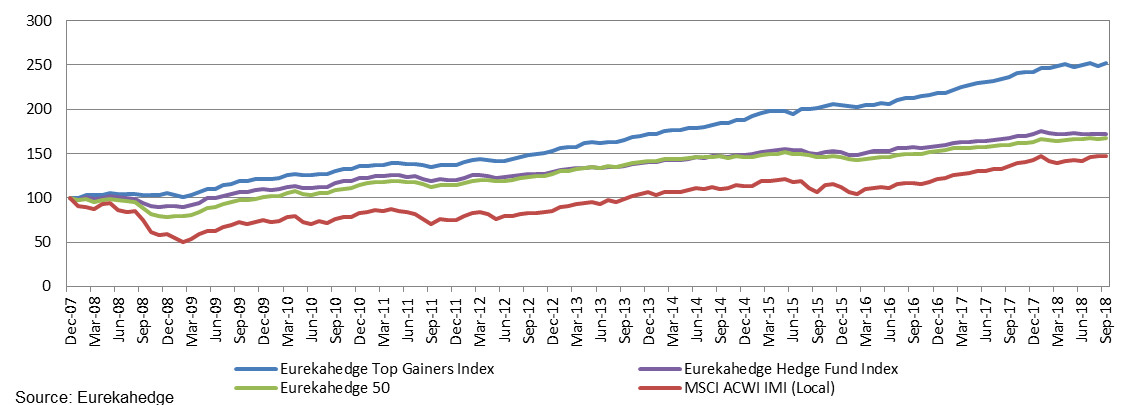
Over the long-term period starting from the end of 2007, the Eurekahedge Top Gainers Index has returned 8.99% per annum, significantly outperforming the annualised returns posted by the Eurekahedge Hedge Fund Index (4.92%), the Eurekahedge 50 (4.63%), and the MSCI ACWI IMI in local currencies (3.69%).
Table 1: Performance in numbers - Eurekahedge Top Gainers Index against comparable benchmarks
|
Eurekahedge Top Gainers Index
|
Eurekahedge Hedge Fund Index
|
Eurekahedge 50
|
MSCI ACWI IMI (Local)
|
|
|---|---|---|---|---|
|
2008
|
5.43%
|
(9.61%)
|
(21.58%)
|
(41.12%)
|
|
2009
|
15.58%
|
21.30%
|
29.35%
|
28.10%
|
|
2010
|
11.24%
|
11.55%
|
13.12%
|
9.99%
|
|
2011
|
1.15%
|
(1.72%)
|
(0.17%)
|
(9.02%)
|
|
2012
|
11.70%
|
7.39%
|
11.10%
|
13.56%
|
|
2013
|
12.01%
|
9.13%
|
11.69%
|
23.80%
|
|
2014
|
9.51%
|
5.12%
|
3.04%
|
6.82%
|
|
2015
|
9.01%
|
2.22%
|
(0.01%)
|
(0.52%)
|
|
2016
|
6.80%
|
4.76%
|
4.27%
|
7.33%
|
|
2017
|
10.70%
|
8.43%
|
6.96%
|
17.51%
|
|
June 2018 year-to-date
|
4.23%
|
0.12%
|
2.44%
|
3.78%
|
|
3 year annualised returns
|
7.84%
|
4.79%
|
4.64%
|
11.27%
|
|
3 year annualised volatility
|
3.03%
|
2.69%
|
2.41%
|
8.25%
|
|
3 year Sharpe Ratio (RFR = 2%)
|
1.93
|
1.04
|
1.10
|
1.12
|
|
5 year annualised returns
|
8.88%
|
4.81%
|
4.10%
|
8.36%
|
|
5 year annualised volatility
|
3.20%
|
2.86%
|
2.62%
|
8.67%
|
|
5 year Sharpe Ratio (RFR = 2%)
|
2.15
|
0.98
|
0.80
|
0.73
|
|
10 year annualised returns
|
9.33%
|
6.18%
|
6.51%
|
6.99%
|
|
10 year annualised volatility
|
4.05%
|
4.35%
|
5.12%
|
13.49%
|
|
10 year Sharpe Ratio (RFR = 2%)
|
1.81
|
0.96
|
0.88
|
0.37
|
|
10 year maximum drawdown
|
(4.04%)
|
(9.64%)
|
(17.96%)
|
(40.72%)
|
Source: Eurekahedge
Table 1 provides the detailed risk return statistics of the Eurekahedge Top Gainers Index and comparable investment vehicles represented by the Eurekahedge Hedge Fund Index, the Eurekahedge 50, and the MSCI ACWI IMI (Local). Key takeaways include:
- The
Eurekahedge Top Gainers Index returned 4.23% as of September 2018 year-to-date, vastly outperforming the broader hedge fund industry which ended flat over the same period. The top gainer hedge funds also managed to outperform the underlying global equity market which edged higher in September thanks to the improving outlook of the global trade tension and PBOC’s intervention into the market. - The top fund managers tracked by the
Eurekahedge Top Gainers Index have been able to especially distinguish themselves during periods of notable market downturns such as 2008, 2011, and 2015, in which they returned 5.43%, 1.15%, and 9.01% respectively, in contrast to the 41.12%, 9.02%, and 0.52% losses posted by the MSCI ACWI IMI (Local) during those years. - In terms of risk-adjusted performance, the Eurekahedge Top Gainers Index managed to generate Sharpe ratios of 1.93, 2.15, and 1.81 over the last three, five, and ten years respectively. These figures are significantly higher than those generated by average hedge fund managers, as represented by the Eurekahedge Hedge Fund Index.
- The downside protection exhibited by these skilled hedge fund managers could also be observed from the -4.04% maximum drawdown posted by the Eurekahedge Top Gainers Index over the last 10 years, vastly outperforming the Eurekahedge Hedge Fund Index and the underlying equity market which posted maximum drawdowns of -9.64% and -40.72% respectively over the same period
|
FORT Global Contrarian LP2
|
Vontobel Fund - TwentyFour Strategic Income Fund N GBP3 |
|
“FORT is a quantitative, systematic hedge fund focused on the global futures and equities markets. The firm has experienced asset growth over the past couple years and AUM now exceeds US$5.4 billion. One of FORT’s strategies is Global Contrarian. Contrarian is a “trend anticipation” strategy that manages approximately US$2.9 billion. From inception in October 2002 – October 2018, the Contrarian program has had a 9.6% annualised return with a 10.9% annualised standard deviation.
Contrarian has some elements of trend but is designed to also benefit from the volatility, or noise, surrounding the trend. We believe this helps the model navigate turning points in markets better than classic trend-followers, who typically need to see a market reversal before changing positions. Another distinguishing feature is the adaptability of the program, allowing it to systematically and dynamically reallocate risk based on the opportunity set. While trend-followers exhibit high correlation to each other (typically 0.8 – 0.9), we expect Contrarian to exhibit a positive but lower correlation to trend. Historically, Contrarian’s correlation to the SG Trend Index has been 0.55. It is predominantly used by allocators seeking a complement to their trend following exposure.”
FORT LP |
“The strategy delivered strong returns in 2017, which was generally a positive year for credit. However, we believe our performance against benchmarks and peers during the extremely challenging conditions of 2018 also demonstrates the advantages of the strategy and our specialism in fixed income. We took on risk where we thought appropriate and looked to capture relative value performance within our favoured sectors, and we feel our clients appreciate our constant focus on the unwritten rule of fixed income, which is capital preservation at all times. TwentyFour’s Strategic Income Fund is a long-only, unlevered and flexible multi-sector bond fund. We believe what separates us from our peers is our people and our process. This is a truly global fund that is constrained by risk rather than reach, with active management of all key risk metrics by a team of fixed income specialists with decades of bond market experience between them. The rise in assets under management in the past 12 months has taken us to just over £1.5bn, giving us a large, liquid fund whose size doesn’t hamper our ability to execute the strategy.”
TwentyFour Asset Management LLP |
Table 2: Correlation matrix
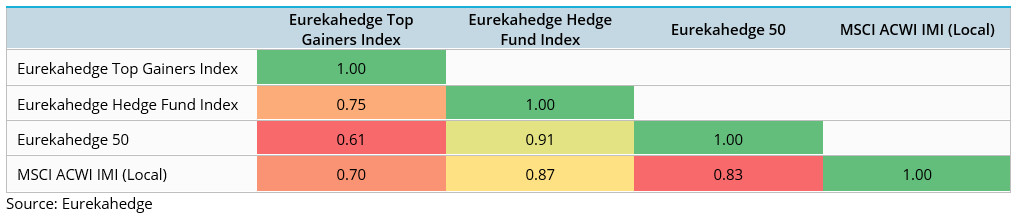
Table 2 provides the correlation values between the performances of the four indices shown in the previous table. The Eurekahedge Hedge Fund Index and the Eurekahedge 50 generated the highest correlation coefficient of 0.91, and both posted correlation coefficients greater than 0.80 against the underlying equity market represented by the MSCI ACWI IMI (Local). On the other hand, the Eurekahedge Top Gainers Index was significantly less correlated to the underlying equity market performance, with a correlation coefficient of 0.70.
|
CC&L Q Global Equity Market Neutral Strategy 4
|
BlueBay Global Sovereign Opportunities Fund - Class I EUR5 |
|---|---|
|
“In this environment, the investment opportunity associated with our return forecasts is slightly below longer-term averages, although not significantly. From a risk standpoint, although volatility and the associated market risk forecasts have increased in isolated areas within our global investment universe (e.g., Turkey, Brazil), generally both factor- and stock-specific risk forecasts are low. The factor tilts in the portfolio shifted slightly during the quarter. This was primarily a result of several model enhancements introduced in June, when we introduced a more systematic approach to how we assess the speed and magnitude of stock price responses to changing information about companies. This has resulted in adjustments in the turnover of some of our measures. More specifically, the horizon of our industry forecasts has become shorter, which reduced the attractiveness of the measure. Conversely, the horizon of several of our opportunity measures increased, which increased the attractiveness of those measures. The expected contribution of our different measures to the portfolio’s added value has tilted slightly more toward contribution from our stock (bottom-up) insights and slightly less from our industry insights. Below are the distinguishing factors of this fund relative to similar peers in the market:
Connor Clark & Lunn Investment Management Ltd |
“The strategy is built on established investment grade and emerging market institutional platforms at BlueBay and adopts a team-based approach which formalises macro directionality and idiosyncratic risk exposures. The investment process aims to capture alpha by building on macro thematic ideas formulated around international politics and policy, taking directional views on global rates, FX, spreads and sovereign bonds. The strategy prides itself on a robust, repeatable process that combines both macro and fundamental bottom-up analysis that helps maximise the probability of successful outcomes. Liquidity, simplicity, risk management and transparency underpin the investment process. As the strategy approaches its 3-year track record in December 2018, the positive performance since inception has seen a successful asset raise with strategy AUM at US$1.6 billion (UCITS US$1.3 billion) and investor interest remains high as evidenced by the current sales pipeline. 2018’s volatile markets have brought fresh challenges for the strategy where success has been found in Q1 positioning, but returns have been more modest in H2 as weak emerging markets and threats to the European periphery (predominantly Italy) have challenged our investment views. The team has cut risk in line with risk management protocols and has increased downside protection through defensive trades, however current valuations and heightened volatility are offering good entry points for trades into the year end. The key is maintaining investment process discipline, managing risk exposures in line with the strategy’s design and upholding transparency to clients.”
BlueBay Asset Management LLP |
Figure 3 below provides the 12-months rolling alpha of the three alternative investment vehicles against the underlying global equity market. Since the end of 2010, the Eurekahedge Top Gainers Index has almost consistently maintained an alpha of at least 0.40% over the MSCI ACWI IMI (Local).
Figure 3: 12-months rolling Alpha against underlying equity markets (RFR = 0%)

Table 3 provides the strategic mandates, as well as the risk-return profiles of twenty-five of the hedge funds in the Eurekahedge database which grew their AUM significantly over the first three quarters of 2018.
|
PIMCO Tactical Opportunities Fund 6
|
|---|
|
“The PIMCO Tactical Opportunities Master Fund (“Tac Opps” or, the “Fund”) was launched in February 2013, targeting approximately 10% annualised net returns and spanning public and private credit markets. The strategy employs a flexible approach to investing in global credit markets with the ability to allocate capital across residential, commercial, corporate and specialty credit. The hybrid structure allows for a focus on assets with attractive return potential and limited liquidity. As such, Tac Opps seeks to capture illiquidity and complexity premiums embedded in less trafficked segments of the markets with low correlations to equities and fixed income. Importantly, Tac Opps partially hedges market beta in an effort to limit downside risk, improve risk-adjusted returns, and provide diversification at the portfolio level. As part of PIMCO’s US$35 billion alternatives complex, the fund benefits from the breadth and sourcing capabilities of PIMCO across public and private assets, depth of dedicated Alternative investment resources, and differentiated idea generation. Interest in Tac Opps has been driven by the strong track record, dynamic capital allocation and hybrid structure. The Fund’s Class A series returned 10.8% after fees in 2017, and is up 6.4% as of October 2018 year-to-date. Returns have been driven by a combination of complex structured credit, private debt and real estate related assets, select corporate debt exposure, and opportunistically providing liquidity during credit dislocations and periods of market stress. PIMCO continues to expand its sourcing channels across private markets which we believe will broaden the opportunity set for the Fund. PIMCO plans to limit fund subscriptions in 2019 to digest growth and focus on continued strong performance.”
Pacific Investment Management Company LLC |
|
AUM Growth (US$ million) |
Main Investment Strategy |
2018 Return |
2017 Return |
Annualised Return |
Annualised Standard Deviation |
Sharpe Ratio |
Maximum Drawdown |
Track Record (year) |
|---|---|---|---|---|---|---|---|---|
|
4,687 |
Fixed income |
(0.02%)
|
4.88% |
3.11% |
2.19% |
1.42 |
(3.02%)
|
7.8 |
|
4,303 |
Macro |
5.11% |
4.83% |
4.41% |
3.88% |
1.14 |
(4.45%)
|
8.2 |
|
4,300 |
Long/short equities |
9.21% |
14.48% |
10.70% |
10.19% |
1.05 |
(35.66%)
|
13.2 |
|
3,740 |
Long/short equities |
0.39% |
7.96% |
6.12% |
4.65% |
1.31 |
(5.48%)
|
9.3 |
|
1,645 |
Arbitrage |
3.67% |
4.74% |
4.58% |
4.68% |
0.98 |
(18.01%)
|
18.4 |
|
1,627 |
Macro |
2.34% |
2.05% |
8.27% |
8.19% |
1.01 |
(6.87%)
|
5.0 |
|
1,498 |
Fixed income |
21.98% |
14.64% |
17.34% |
15.24% |
1.14 |
(15.04%)
|
8.2 |
|
1,167 |
Macro |
21.73% |
19.70% |
16.39% |
15.88% |
1.03 |
(16.55%)
|
7.6 |
|
1,156 |
Multi-strategy |
6.35% |
10.83% |
10.00% |
3.26% |
3.06 |
(1.88%)
|
5.7 |
|
1,025 |
Macro |
3.52% |
9.67% |
6.93% |
9.85% |
0.70 |
(11.48%)
|
8.2 |
|
1,013 |
Fixed income |
(0.63%)
|
8.81% |
4.23% |
3.63% |
1.17 |
(4.92%)
|
2.8 |
|
914 |
Multi-strategy |
6.67% |
10.97% |
8.92% |
11.14% |
0.80 |
(8.75%)
|
6.6 |
|
901 |
Multi-strategy |
0.16% |
7.29% |
2.41% |
7.11% |
0.34 |
(12.60%)
|
9.0 |
|
795 |
Arbitrage |
4.21% |
4.58% |
4.16% |
4.63% |
0.90 |
(7.26%)
|
5.6 |
|
780 |
Long/short equities |
(0.71%)
|
5.86% |
2.49% |
4.69% |
0.53 |
(10.39%)
|
7.3 |
|
726 |
CTA/managed futures |
0.30% |
6.56% |
9.92% |
10.89% |
0.91 |
(17.42%)
|
16.0 |
|
707 |
Macro |
8.41% |
22.72% |
15.45% |
4.43% |
3.49 |
(3.60%)
|
5.8 |
|
700 |
Distressed debt |
14.25% |
15.46% |
14.27% |
6.57% |
2.17 |
(19.83%)
|
10.3 |
|
640 |
Fixed income |
0.70% |
5.55% |
6.70% |
5.16% |
1.30 |
(4.07%)
|
2.8 |
|
629 |
Long/short equities |
(1.99%)
|
9.23% |
10.99% |
16.48% |
0.67 |
(35.99%)
|
16.4 |
|
543 |
Long/short equities |
3.80% |
5.81% |
7.13% |
7.49% |
0.95 |
(14.57%)
|
13.8 |
|
516 |
CTA/managed futures |
2.22% |
5.78% |
8.47% |
8.33% |
1.02 |
(9.32%)
|
11.4 |
|
513 |
Long/short equities |
7.20% |
4.89% |
4.96% |
5.50% |
0.90 |
(5.56%)
|
6.5 |
|
482 |
Long/short equities |
1.45% |
8.41% |
6.26% |
6.09% |
1.03 |
(9.08%)
|
6.8 |
|
461 |
Fixed income |
4.65% |
6.26% |
6.42% |
0.19% |
34.00 |
0.00% |
4.2 |
Source: Eurekahedge
The full article inclusive of all charts and tables is available in The Eurekahedge Report accessible to paying subscribers only.
Subscribers may continue to login as usual to download the full report and non-subscribers may email database@eurekahedge.com to enquire on how to obtain the full research report
2 Source: FORT LP. Past performance is not indicative of future results. This material does not constitute investment advice or counsel or solicitation for investment in any fund or product mentioned.
3 Source: TwentyFour Asset Management LLP. Past performance is not indicative of future results. This material does not constitute investment advice or counsel or solicitation for investment in any fund or product mentioned.
4 Source: Connor Clark & Lunn Investment Management Ltd. Past performance is not indicative of future results. This material does not constitute investment advice or counsel or solicitation for investment in any fund or product mentioned.
5 Source: BlueBay Asset Management LLP. Past performance is not indicative of future results. This material does not constitute investment advice or counsel or solicitation for investment in any fund or product mentioned.
6 Source: Pacific Investment Management Company LLC, an entity registered with and regulated by the US Securities and Exchange Commission. Past performance is not indicative of future results. This material does not constitute investment advice or counsel or solicitation for investment in any fund or product mentioned.