

|
|
Indices
Index Flash Update - 11 August 2020
EQUAL WEIGHTED HEDGE FUND INDICES
ASSET WEIGHTED HEDGE FUND INDICES
SPECIALIST ALTERNATIVE FUND INDICES
INVESTIBLE BENCHMARK INDICES
METHODOLOGIES
INDEX PRESS RELEASES
- Index Flash Update (June 2022)
- Index Flash Update (May 2022)
- Index Flash Update (April 2022)
- Eurekahedge launches new benchmark Eurekahedge Multi-Factor Risk Premia Index
- Eurekahedge and CBOE launch four benchmark indices tracking volatility-based investment strategies
- Eurekahedge and MPI announce new benchmark index tracking the top 50 hedge funds
- Eurekahedge and ILS Advisers launch new USD hedge index
- Eurekahedge launches new insurance linked securities index
- Eurekahedge Asset Weighted Index goes live
- Eurekahedge Asset Weighted Index press release
- EU Benchmark Regulation
| Hedge funds continue strong run with Chinese hedge funds in the lead |
|---|
|
The Eurekahedge Hedge Fund Index was up 2.61% in July, bringing its year-to-date return to 1.73%, supported by the robust performance of underlying global equity markets as represented by the MSCI ACWI IMI (Local) which gained 3.67% over the month. The highlight of the month was the continued support for markets by global central banks, which once again pulled no surprises. While the debate around MMT (Modern Monetary Theory) continues to pick pace, in the presence of high unemployment and the absence of inflation, it appears that MMT proponents will have a walk over of sorts. This should continue to bode well for financial markets which are so far defying the natural laws of gravity that has otherwise stalled real economic activity globally. In the US, despite the fear of the increasing number of COVID-19 cases, the equity market in the region exhibited a strong run driven by the upbeat Q2 earnings of tech-companies, particularly the FAANG stocks, which beat market expectation. The tech-heavy NASDAQ was up 8.82%, pushing its year-to-date return to 19.76%, while the S&P 500 returned 6.53% throughout the month, bringing its 2020 performance back into positive territory. On the other hand, European equities underperformed their regional peers as the US-China tensions and weak corporate earnings weigh down on their performance. The DAX ended the month of July largely flat, while the CAC 40 registered 3.09% losses over the same period. Over in Asia, the Chinese economy displays a robust recovery from the crisis, as seen from their strong PMI numbers, particularly their double-digit Q2 GDP growth, which contributed to the strong performance of underlying equity market returns in the region. The Shenzhen Composite and CSI 300 registered 14.24% and 12.20% throughout the month of July. Returns were positive across geographic mandates in July, with fund managers focusing on Asia ex-Japan up 4.52%, outperforming their North American and European peers who were up 2.45% and 2.32%, respectively. Across strategies, CTA/managed futures, multi-strategy and macro fund managers were up 4.11%, 3.06% and 3.04% respectively throughout the month. The unspoken expectation in the market is that if China can recover from Coronavirus without the type of central bank intervention and fiscal support we are seeing in the West, then perhaps there is still hope for a graceful recovery for the rest of the world. Roughly 79.1% of the underlying constituents of the Eurekahedge Hedge Fund Index posted positive returns in July, and 20.2% of the hedge fund managers in the database were able to maintain double-digit returns over the first seven months of 2020. |
| Below are the key highlights for the month of July 2020 |
|---|
|
| Index of the Month | Jul 2020* |
2020 Returns | 2019 Returns |
|---|---|---|---|
| Eurekahedge Equity Long Bias Hedge Fund Index | 2.52 | -3.54 | 16.70 |
Main Indices
| Main Eurekahedge Indices | Jul 2020* |
2020 Returns | 2019 Returns |
|---|---|---|---|
| Eurekahedge Hedge Fund Index | 2.61 | 1.73 | 8.79 |
| Eurekahedge Fund of Funds Index | 3.43 | 2.41 | 8.70 |
| Eurekahedge Long-only Absolute Return Fund Index | 2.88 | -4.92 | 16.39 |
| Eurekahedge Islamic Fund Index | 6.43 | 4.09 | 10.00 |
Regional Indices
| Eurekahedge Regional Indices | Jul 2020* |
2020 Returns | 2019 Returns |
|---|---|---|---|
| Eurekahedge North American Hedge Fund Index | 2.45 | 1.45 | 9.25 |
| Eurekahedge European Hedge Fund Index | 2.32 | -2.32 | 7.48 |
| Eurekahedge Eastern Europe & Russia Hedge Fund Index | 10.32 | -7.66 | 18.47 |
| Eurekahedge Japan Hedge Fund Index | -1.42 | -8.58 | 6.53 |
| Eurekahedge Emerging Markets Hedge Fund Index | 4.43 | 5.33 | 12.72 |
| Eurekahedge Asia ex Japan Hedge Fund Index | 4.52 | 7.77 | 11.97 |
| Eurekahedge Latin American Hedge Fund Index | 4.82 | 0.76 | 15.22 |
North American fund managers returned 2.45% in the month of July, bringing their year-to-date return to 1.45%. The strong corporate earnings of the tech companies supported fund managers performance, with NASDAQ up 8.82% during the month. In the same vein, Asia ex-Japan managers gained 4.52%, as the Chinese economy exhibited a strong recovery from the crisis, which supported the performance of the risk assets’ in the region.
Strategy Indices
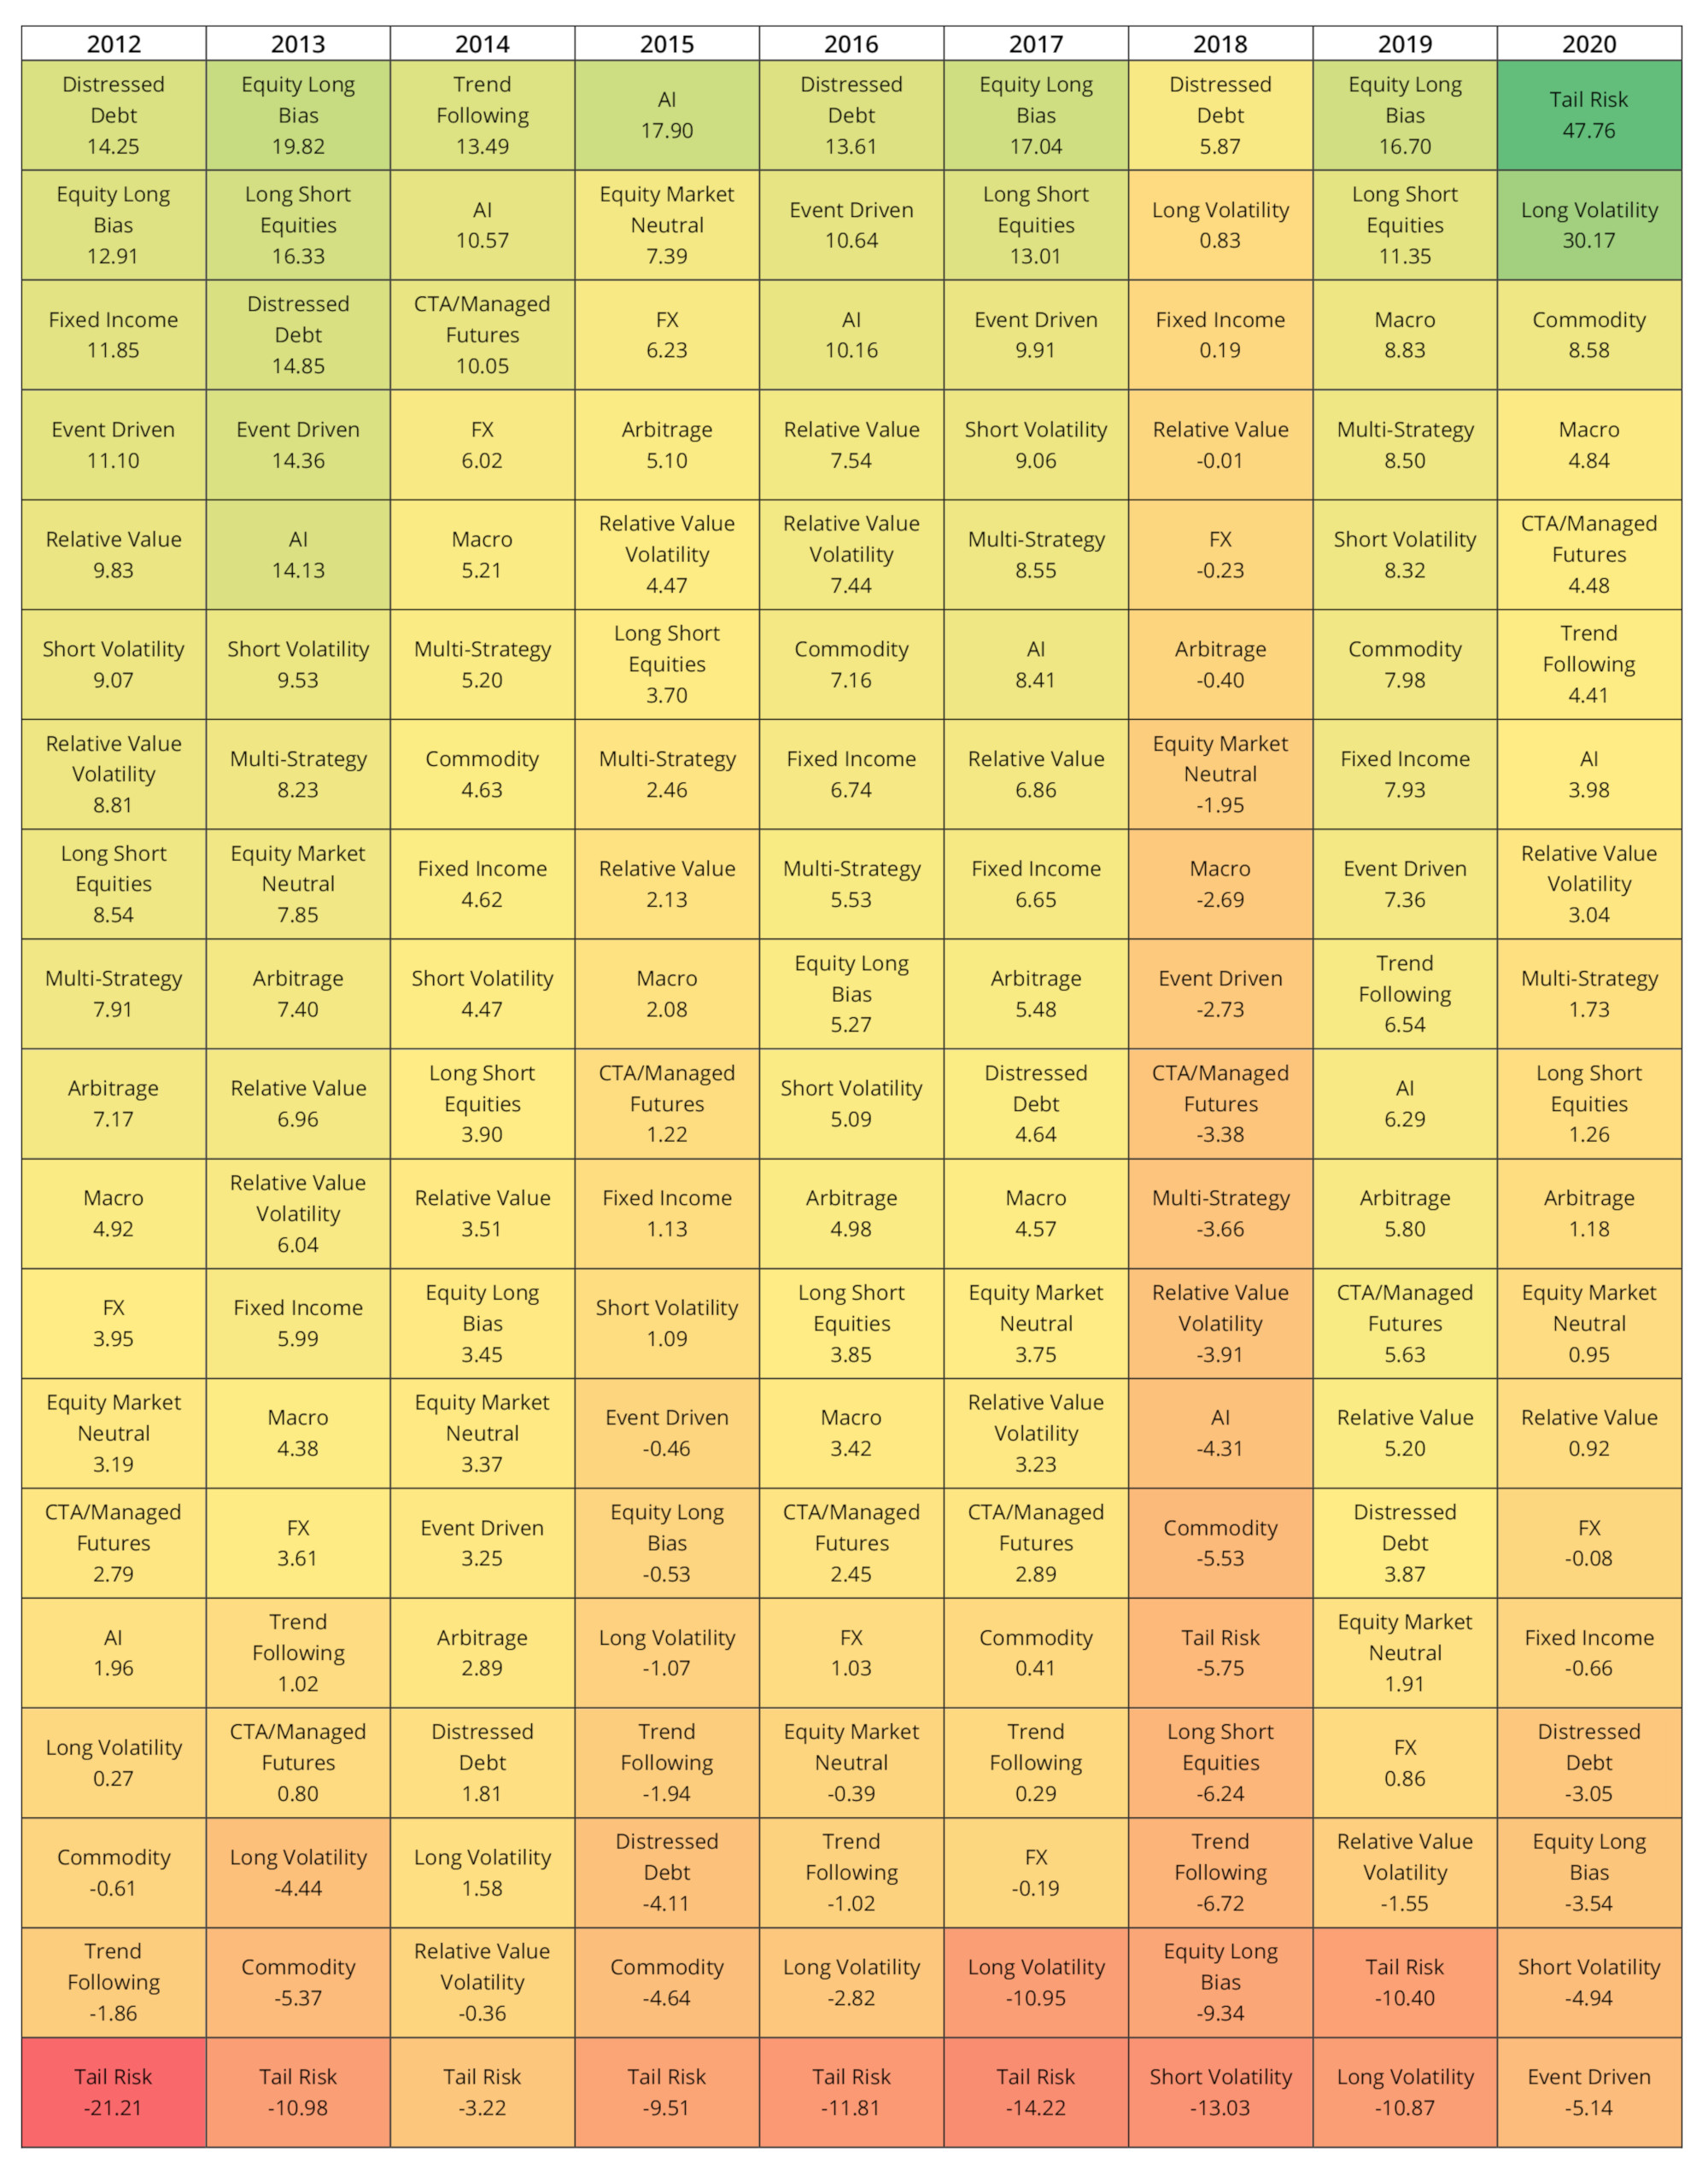
Returns were mostly positive across strategic mandates in July with CTA/managed futures, multi-strategy and macro strategic mandates up 4.11%, 3.06% and 3.04% respectively. The strong performance of the risk assets provided support of these strategies during the month. The fixed income mandate was also up 1.31% in July, as dovish remarks of the central banks pushed the yields lower.
Table 1: Strategy return map
| Eurekahedge Strategy Indices | Jul 2020* |
2020 Returns | 2019 Returns |
|---|---|---|---|
| Eurekahedge Arbitrage Hedge Fund Index | 0.91 | 1.18 | 5.80 |
| Eurekahedge CTA/Managed Futures Hedge Fund Index | 4.11 | 4.48 | 5.63 |
| Eurekahedge Distressed Debt Hedge Fund Index | -0.16 | -3.05 | 3.87 |
| Eurekahedge Event Driven Hedge Fund Index | 1.79 | -5.14 | 7.36 |
| Eurekahedge Fixed Income Hedge Fund Index | 1.31 | -0.66 | 7.93 |
| Eurekahedge Long Short Equities Hedge Fund Index | 2.52 | 1.26 | 11.35 |
| Eurekahedge Macro Hedge Fund Index | 3.04 | 4.84 | 8.83 |
| Eurekahedge Multi-Strategy Hedge Fund Index | 3.06 | 1.73 | 8.50 |
| Eurekahedge Relative Value Hedge Fund Index | 1.87 | 0.92 | 5.20 |
| CBOE Eurekahedge Long Volatility Hedge Fund Index | 0.25 | 30.17 | -10.87 |
| CBOE Eurekahedge Relative Value Volatility Hedge Fund Index | 1.01 | 3.04 | -1.55 |
| CBOE Eurekahedge Short Volatility Hedge Fund Index | 19.27 | -4.94 | 8.32 |
| CBOE Eurekahedge Tail Risk Hedge Fund Index | -1.05 | 47.76 | -10.40 |
| Eurekahedge Equity Long Bias Hedge Fund Index | 2.52 | -3.54 | 16.70 |
| Eurekahedge Equity Market Neutral Hedge Fund Index | 1.05 | 0.95 | 1.91 |
| Eurekahedge Trend Following Index | 4.18 | 4.41 | 6.54 |
| Eurekahedge FX Hedge Fund Index | 1.54 | -0.08 | 0.86 |
| Eurekahedge Commodity Hedge Fund Index | 7.58 | 8.58 | 7.98 |
| Eurekahedge Crypto-Currency Hedge Fund Index | 20.97 | 50.15 | 15.56 |
| Eurekahedge AI Hedge Fund Index | 1.35 | 3.98 | 6.29 |
| Eurekahedge ILS Advisers Index | 0.61 | 1.48 | 0.92 |
| Eurekahedge Global Hedge Fund Indices by Fund Size | Jul 2020* |
2020 Returns | 2019 Returns |
|---|---|---|---|
| Eurekahedge Small Hedge Fund Index (< US$100m) | 3.02 | 1.90 | 8.67 |
| Eurekahedge Medium Hedge Fund Index (US$100m - US$500m) | 2.12 | 1.34 | 8.89 |
| Eurekahedge Large Hedge Fund Index (> US$500m) | 1.93 | 0.15 | 8.88 |
| Eurekahedge Billion Dollar Hedge Fund Index | 2.03 | -0.16 | 8.60 |
| Eurekahedge Asset Weighted Indices | Jul 2020* |
2020 Returns | 2019 Returns |
|---|---|---|---|
| Eurekahedge Asset Weighted Index – USD | 3.54 | -1.75 | 6.97 |
| Eurekahedge TOP100 Asset Weighted Index – USD | 3.20 | -2.80 | 6.89 |
| Eurekahedge TOP300 Asset Weighted Index - USD | 3.41 | -2.06 | 7.09 |
| Asia-Eurekahedge Indices | Jul 2020* |
2020 Returns | 2019 Returns |
|---|---|---|---|
| Eurekahedge Greater China Hedge Fund Index | 6.25 | 16.97 | 17.18 |
| Eurekahedge India Hedge Fund Index | 4.63 | 2.29 | 2.01 |
Click here to download our daily indices for free. Our indices are updated with the latest fund returns at 23:30 GMT every day and we encourage you to use them to benchmark your portfolio or fund performance. If you would like us to create a bespoke index for you, please let us know.
